58 questions · CAT · page 2 of 3

CAT questions on Reasoning-based DI

Actual CAT questions on this topic from past papers, newest first. Each links back to its paper.

Download PDF Questions + answer key 1063 KB With solutions 2966 KB Free with a sign-in.

Answer the next 4 questions based on the information given below.

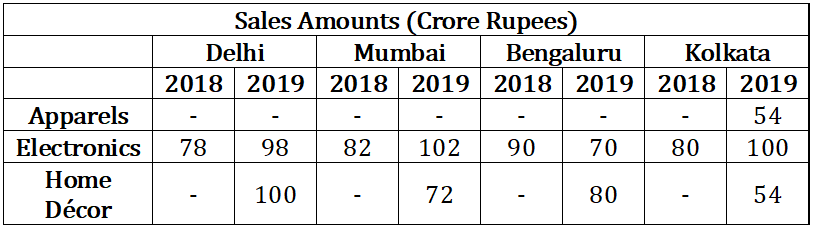
A chain of departmental stores has outlets in Delhi, Mumbai, Bengaluru and Kolkata. The sales are categorized by its three departments – ‘Apparel’, ‘Electronics’, and ‘HomeDecor’. An Accountant has been asked to prepare a summary of the 2018 and 2019 sales amounts for an internal report. He has collated partial information and prepared the following table.

​​​​​​​

The following additional information is known.

  • The sales amounts in the Apparel departments were the same for Delhi and Kolkata in 2018.
  • The sales amounts in the Apparel departments were the same for Mumbai and Bengaluru in 2018. This sales amount matched the sales amount in the Apparel department for Delhi in 2019.
  • The sales amounts in the HomeDecor departments were the same for Mumbai and Kolkata in 2018.
  • The sum of the sales amounts of four Electronics departments increased by the same amount as the sum of the sales amounts of four Apparel departments from 2018 to 2019.
  • The total sales amounts of the four HomeDecor departments increased by Rs 70 Crores from 2018 to 2019.
  • The sales amounts in the HomeDecor departments of Delhi and Bengaluru each increased by Rs 20 Crores from 2018 to 2019.
  • The sales amounts in the Apparel departments of Delhi and Bengaluru each increased by the same amount in 2019 from 2018. The sales amounts in the Apparel departments of Mumbai and Kolkata also each increased by the same amount in 2019 from 2018.
  • The sales amounts in the Apparel departments of Delhi, Kolkata and Bengaluru in 2019 followed an Arithmetic 
Q26 CAT 2020 LRDI Slot 2 MULTIPLE CHOICE

What was the total sales amount, in Crore Rupees, in 2019 for the chain of departmental stores?

Open question

Answer the next 4 questions based on the information given.

XYZ organization got into the business of delivering groceries to home at the beginning of the last month. They have a two-day delivery promise. However, their deliveries are unreliable. An order booked on a particular day may be delivered the next day or the day after. If the order is not delivered at the end of two days, then the order is declared as lost at the end of the second day. XYZ then does not deliver the order, but informs the customer, marks the order as lost, returns the payment and pays a penalty for non-delivery.

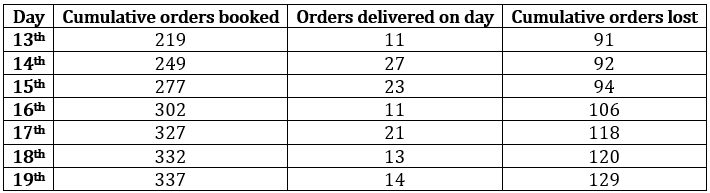
The following table provides details about the operations of XYZ for a week of the last month. The first column gives the date, the second gives the cumulative number of orders that were booked up to and including that day. The third column represents the number of orders delivered on that day. The last column gives the cumulative number of orders that were lost up to and including that day.

It is known that the numbers of orders that were booked on the 11th, 12th, and 13th of the last month that took two days to deliver were 4, 6, and 8 respectively.

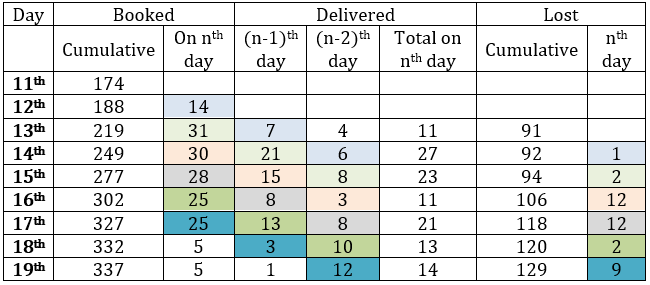
​​​​​​​

Q27 CAT 2020 LRDI Slot 3 MULTIPLE CHOICE

Among the following days, the largest fraction of orders booked on which day was lost?

Open question
Q28 CAT 2020 LRDI Slot 3 MULTIPLE CHOICE

On which of the following days was the number of orders booked the highest?

Open question
Q29 CAT 2020 LRDI Slot 3 MULTIPLE CHOICE

The delivery ratio for a given day is defined as the ratio of the number of orders booked on that day which are delivered on the next day to the number of orders booked on that day which are delivered on the second day after booking. On which of the following days, was the delivery ratio the highest?

Open question
Q30 CAT 2020 LRDI Slot 3 MULTIPLE CHOICE

The average time taken to deliver orders booked on a particular day is computed as follows. Let the number of orders delivered the next day be x and the number of orders delivered the day after be y. Then the average time to deliver order is (x+2y)/(x+y). On which of the following days was the average time taken to deliver orders booked the least?

Open question

Answer the following question based on the information given below.

The multi-layered pie-chart below shows the sales of LED television sets for a big retail electronics outlet during 2016 and 2017. The outer layer shows the monthly sales during this period, with each label showing the month followed by sales figure of that month. For some months, the sales figures are not given in the chart. The middle-layer shows quarter wise aggregate sales figures (in some cases, aggregate quarter-wise sales numbers are not given next to the quarter). The innermost layer shows annual sales. It is known that the sales figures during the three months of the second quarter (April, May, June) of 2016 form an arithmetic progression, as do the three monthly sales figures in the fourth quarter (October, November, December) of that year.

Q31 CAT 2018 LRDI Slot 1 MULTIPLE CHOICE

What is the percentage increase in sales in December 2017 as compared to the sales in December 2016?

Open question
Q32 CAT 2018 LRDI Slot 1 MULTIPLE CHOICE

In which quarter of 2017 was the percentage increase in sales from the same quarter of 2016 the highest?

Open question
Q33 CAT 2018 LRDI Slot 1 MULTIPLE CHOICE

During which quarter was the percentage decrease in sales from the previous quarter’s sales the highest?

Open question
Q34 CAT 2018 LRDI Slot 1 MULTIPLE CHOICE

During which month was the percentage increase in sales from the previous month’s sales the highest?

Open question

Answer the following question based on the information given below.

An agency entrusted to accredit colleges looks at four parameters: faculty quality (F), reputation (R), placement quality (P), and infrastructure (I). The four parameters are used to arrive at an overall score, which the agency uses to give an accreditation to the colleges. In each parameter, there are five possible letter grades given, each carrying certain points: A
(50 points), B (40 points), C (30 points), D (20 points), and F (0 points). The overall score for a college is the weighted sum of the points scored in the four parameters. The weights of the parameters are 0.1, 0.2, 0.3 and 0.4 in some order, but the order is not disclosed. Accreditation is awarded based on the following scheme:

​​​​​​​

Eight colleges apply for accreditation, and receive the following grades in the four parameters (F, R, P, and I):

​​​​​​​

It is further known that in terms of overall scores:

  1. High Q is better than Best Ed;
  2. Best Ed is better than Cosmopolitan; and
  3. Education Aid is better than A-one.
Q35 CAT 2018 LRDI Slot 2 MULTIPLE CHOICE

What is the weight of the faculty quality parameter?

Open question
Q36 CAT 2018 LRDI Slot 2 TYPE IN THE ANSWER

How many colleges receive the accreditation of AAA?

Open question
Q37 CAT 2018 LRDI Slot 2 TYPE IN THE ANSWER

What is the highest overall score among the eight colleges?

Open question
Q38 CAT 2018 LRDI Slot 2 MULTIPLE CHOICE

How many colleges have overall scores between 31 and 40, both inclusive?

Open question

Answer the following question based on the information given below.

Each of the 23 boxes in the picture below represents a product manufactured by one of the following three companies: Alfa, Bravo and Charlie. The area of a box is proportional to the revenue from the corresponding product, while its centre represents the Product popularity and Market potential scores of the product (out of 20). The shadings of some of the boxes have got erased.

The companies classified their products into four categories based on a combination of scores (out of 20) on the two parameters – Product popularity and Market potential as given below:

​​​​​​​

The following facts are known:

  1. Alfa and Bravo had the same number of products in the Blockbuster category.
  2. Charlie had more products than Bravo but fewer products than Alfa in the No-hope category.
  3. Each company had an equal number of products in the Promising category.
  4. Charlie did not have any product in the Doubtful category, while Alfa had one product more than Bravo in this category.
  5. Bravo had a higher revenue than Alfa from products in the Doubtful category.
  6. Charlie had a higher revenue than Bravo from products in the Blockbuster category.
  7. Bravo and Charlie had the same revenue from products in the No-hope category.
  8. Alfa and Charlie had the same total revenue considering all products.
Q39 CAT 2018 LRDI Slot 2 MULTIPLE CHOICE

Considering all companies' products, which product category had the highest revenue?

Open question
Q40 CAT 2018 LRDI Slot 2 MULTIPLE CHOICE

Which of the following is the correct sequence of numbers of products Bravo had in No-hope, Doubtful, Promising and Blockbuster categories respectively?

Open question
Q41 CAT 2018 LRDI Slot 2 MULTIPLE CHOICE

Which of the following statements is NOT correct?

Open question
Q42 CAT 2018 LRDI Slot 2 MULTIPLE CHOICE

If the smallest box on the grid is equivalent to revenue of Rs.1 crore, then what approximately was the total revenue of Bravo in Rs. crore?

Open question

Answer the following question based on the information given below.

Simple Happiness index (SHI) of a country is computed on the basis of three parameters: social support (S), freedom to life choices (F) and corruption perception (C). Each of these three parameters is measured on a scale of 0 to 8 (integers only). A country is then categorized based on the total score obtained by summing the scores of all the three parameters, as shown in the following table:

​​​​​​​

Following diagram depicts the frequency distribution of the scores in S, F and C of 10 countries – Amda, Benga, Calla, Delma, Eppa, Varsa, Wanna, Xanda, Yanga and Zooma:

Further, the following are known:

  1. Amda and Calla jointly have the lowest total score, 7, with identical scores in all the three parameters.
  2. Zooma has a total score of 17.
  3. All the 3 countries, which are categorized as happy, have the highest score in exactly one parameter.
Q43 CAT 2017 LRDI Slot 1 TYPE IN THE ANSWER

What is Amda's score in F?

Open question
Q44 CAT 2017 LRDI Slot 1 TYPE IN THE ANSWER

What is Zooma’s score in S?

Open question
Q45 CAT 2017 LRDI Slot 1 MULTIPLE CHOICE

Benga and Delma, two countries categorized as happy, are tied with the same total score. What is the maximum score they can have?

Open question
Q46 CAT 2017 LRDI Slot 1 MULTIPLE CHOICE

If Benga scores 16 and Delma scores 15, then what is the maximum number of countries with a score of 13?

Open question

Directions for next 4 questions.

Funky Pizzaria was required to supply pizzas to three different parties. The total number of pizzas it had to deliver was 800, 70% of which were to be delivered to party 3 and the rest equally divided between Party 1 and Party 2.

Pizzas could be of Thin Crust (T) or Deep Dish (D) variety and come in either Normal Cheese (NC) or Extra Cheese (EC) versions. Hence, there are four types of pizzas: T-NC, T-EC, D-NC and D-EC. Partial information about proportions of T and NC pizzas ordered by the three parties is given below:

​​​​​​​

Q47 CAT 2017 LRDI Slot 2 MULTIPLE CHOICE

How many Thin Crust pizzas were to be delivered to Party 3?

Open question
Q48 CAT 2017 LRDI Slot 2 MULTIPLE CHOICE

How many Normal Cheese pizzas were required to be delivered to Party 1?

Open question
Q49 CAT 2017 LRDI Slot 2 MULTIPLE CHOICE

For Party 2, if 50% of the Normal Cheese pizzas were of Thin Crust variety, what was the difference between the numbers of T-EC and D-EC pizzas to be delivered to party 2?

Open question
Q50 CAT 2017 LRDI Slot 2 MULTIPLE CHOICE

Suppose that a T-NC pizza cost as much as a D-NC pizza, but 3/5th of the price of a D-EC pizza. A D-EC pizza costs Rs. 50 more than a T-EC pizza, and the latter costs Rs. 500.

If 25% of the Normal Cheese pizzas delivered to Party 1 were of Deep Dish variety, what was the total bill for Party 1?

Open question