A train travels from Station A to Station E, passing through stations B, C, and D, in that order. The train has a seating capacity of 200. A ticket may be booked from any station to any other station ahead on the route, but not to any earlier station.
A ticket from one station to another reserves one seat on every intermediate segment of the route. For example, a ticket from B to E reserves a seat in the intermediate segments B – C, C – D, and D – E.
The occupancy factor for a segment is the total number of seats reserved in the segment as a percentage of the seating capacity. The total number of seats reserved for any segment cannot exceed 200.
The following information is known. 1. Segment C – D had an occupancy factor of 95%. Only segment B – C had a higher occupancy factor. 2. Exactly 40 tickets were booked from B to C and 30 tickets were booked from B to E. 3. Among the seats reserved on segment D – E, exactly four-sevenths were from stations before C. 4. The number of tickets booked from A to C was equal to that booked from A to E, and it was higher than that from B to E. 5. No tickets were booked from A to B, from B to D and from D to E. 6. The number of tickets booked for any segment was a multiple of 10.
Let the number of tickets of type XY be written XY. Tickets A→B, B→D and D→E are zero; BC = 40, BE = 30.
Segment C–D has 95% occupancy, i.e. 190 seats. Only B–C is higher, and all counts are multiples of 10 with a cap of 200, so B–C = 200.
B–C seats = AC + AD + AE + BC + BE ⇒ AC + AD + AE = 200 − 70 = 130.
AC = AE = x with x > 30, so x ≥ 40; and AD = 130 − 2x ≥ 0, so x ∈ {40, 50, 60}.
Seats on D–E from stations before C = AE + BE = x + 30, and this is \(\frac{4}{7}\) of D–E. So D–E = \(\frac{7(x+30)}{4}\), which is a whole multiple of 10 only for x = 50, giving D–E = 140.
Then AD = 30; D–E = AE + BE + CE ⇒ CE = 140 − 80 = 60; C–D = AD + AE + BE + CD + CE = 170 + CD = 190 ⇒ CD = 20.
Let the number of tickets of type XY be written XY. Tickets A→B, B→D and D→E are zero; BC = 40, BE = 30.
Segment C–D has 95% occupancy, i.e. 190 seats. Only B–C is higher, and all counts are multiples of 10 with a cap of 200, so B–C = 200.
B–C seats = AC + AD + AE + BC + BE ⇒ AC + AD + AE = 200 − 70 = 130.
AC = AE = x with x > 30, so x ≥ 40; and AD = 130 − 2x ≥ 0, so x ∈ {40, 50, 60}.
Seats on D–E from stations before C = AE + BE = x + 30, and this is \(\frac{4}{7}\) of D–E. So D–E = \(\frac{7(x+30)}{4}\), which is a whole multiple of 10 only for x = 50, giving D–E = 140.
Then AD = 30; D–E = AE + BE + CE ⇒ CE = 140 − 80 = 60; C–D = AD + AE + BE + CD + CE = 170 + CD = 190 ⇒ CD = 20.
Let the number of tickets of type XY be written XY. Tickets A→B, B→D and D→E are zero; BC = 40, BE = 30.
Segment C–D has 95% occupancy, i.e. 190 seats. Only B–C is higher, and all counts are multiples of 10 with a cap of 200, so B–C = 200.
B–C seats = AC + AD + AE + BC + BE ⇒ AC + AD + AE = 200 − 70 = 130.
AC = AE = x with x > 30, so x ≥ 40; and AD = 130 − 2x ≥ 0, so x ∈ {40, 50, 60}.
Seats on D–E from stations before C = AE + BE = x + 30, and this is \(\frac{4}{7}\) of D–E. So D–E = \(\frac{7(x+30)}{4}\), which is a whole multiple of 10 only for x = 50, giving D–E = 140.
Then AD = 30; D–E = AE + BE + CE ⇒ CE = 140 − 80 = 60; C–D = AD + AE + BE + CD + CE = 170 + CD = 190 ⇒ CD = 20.
Let the number of tickets of type XY be written XY. Tickets A→B, B→D and D→E are zero; BC = 40, BE = 30.
Segment C–D has 95% occupancy, i.e. 190 seats. Only B–C is higher, and all counts are multiples of 10 with a cap of 200, so B–C = 200.
B–C seats = AC + AD + AE + BC + BE ⇒ AC + AD + AE = 200 − 70 = 130.
AC = AE = x with x > 30, so x ≥ 40; and AD = 130 − 2x ≥ 0, so x ∈ {40, 50, 60}.
Seats on D–E from stations before C = AE + BE = x + 30, and this is \(\frac{4}{7}\) of D–E. So D–E = \(\frac{7(x+30)}{4}\), which is a whole multiple of 10 only for x = 50, giving D–E = 140.
Then AD = 30; D–E = AE + BE + CE ⇒ CE = 140 − 80 = 60; C–D = AD + AE + BE + CD + CE = 170 + CD = 190 ⇒ CD = 20.
Let the number of tickets of type XY be written XY. Tickets A→B, B→D and D→E are zero; BC = 40, BE = 30.
Segment C–D has 95% occupancy, i.e. 190 seats. Only B–C is higher, and all counts are multiples of 10 with a cap of 200, so B–C = 200.
B–C seats = AC + AD + AE + BC + BE ⇒ AC + AD + AE = 200 − 70 = 130.
AC = AE = x with x > 30, so x ≥ 40; and AD = 130 − 2x ≥ 0, so x ∈ {40, 50, 60}.
Seats on D–E from stations before C = AE + BE = x + 30, and this is \(\frac{4}{7}\) of D–E. So D–E = \(\frac{7(x+30)}{4}\), which is a whole multiple of 10 only for x = 50, giving D–E = 140.
Then AD = 30; D–E = AE + BE + CE ⇒ CE = 140 − 80 = 60; C–D = AD + AE + BE + CD + CE = 170 + CD = 190 ⇒ CD = 20.
Single-segment tickets are AB, BC, CD and DE: 0 + 40 + 20 + 0 = 60.
Hence, the answer is 60.
The Sustainability Index (SI) of a country at a point in time is an integerbetween 1 and 100. This question is related to SI of six countries – A, B, C, D, E, and F – at three different points in time – 2016, 2020, and 2024. The plot represents the exact changes in their SI, with X-coordinate representing % increase in 2020 from 2016, i.e., (SI in 2020 minus SI in 2016) / (SI in 2016), and Y-coordinate representing % increase in 2024 from 2020. At any point in time, the country with highest SI is ranked 1, while the country with the lowest SI is ranked 6. The following additional facts are known. 1. In 2016, B, C, E, and A had ranks 1, 2, 3, and 4 respectively. 2. F had lower SI than any other country in 2016, 2020, and 2024. 3. In 2024, E was the only country with SI of 90. 4. The range of SI of the six countries was 60 in 2016 as well as in 2024.
Reading the plot: A (25%, 50%), B (-25%, -25%), C (-20%, 40%), D (100%, 20%), E (25%, 20%), F (100%, -25%). So SI2024 = SI2016 \(\times\) (1+X)(1+Y), and every SI is an integer.
B: \(\times \tfrac{3}{4} \times \tfrac{3}{4}\), so B2016 is a multiple of 16. C: \(\times \tfrac{4}{5}\times\tfrac{7}{5}\), so C2016 is a multiple of 25.
2016 ranks B > C > E (60) > A: C2016 = 75 and B2016 = 80 or 96.
2024: A2016 < 60 and A grows by \(\times\tfrac{15}{8}\), so A2016 is a multiple of 8 and at most 48; 48 gives 90 (not allowed, only E has 90). D2016 < A2016 \(\le\) 40 gives D2024 = 2.4D2016 \(\le\) 84. C2024 = 84. So the 2024 maximum is E = 90 and, with range 60, F2024 = 30.
F: \(\times 2 \times 0.75 = \times 1.5\), so F2016 = 20, F2020 = 40. 2016 range 60 gives B2016 = 80, so B2020 = 60, B2024 = 45.
F is lowest in 2020, so A2020 = 1.25A2016 > 40, i.e. A2016 > 32, so A2016 = 40. D2016 is a multiple of 5 between 20 and 40: 25, 30 or 35 (not fixed).
Reading the plot: A (25%, 50%), B (-25%, -25%), C (-20%, 40%), D (100%, 20%), E (25%, 20%), F (100%, -25%). So SI2024 = SI2016 \(\times\) (1+X)(1+Y), and every SI is an integer.
B: \(\times \tfrac{3}{4} \times \tfrac{3}{4}\), so B2016 is a multiple of 16. C: \(\times \tfrac{4}{5}\times\tfrac{7}{5}\), so C2016 is a multiple of 25.
2016 ranks B > C > E (60) > A: C2016 = 75 and B2016 = 80 or 96.
2024: A2016 < 60 and A grows by \(\times\tfrac{15}{8}\), so A2016 is a multiple of 8 and at most 48; 48 gives 90 (not allowed, only E has 90). D2016 < A2016 \(\le\) 40 gives D2024 = 2.4D2016 \(\le\) 84. C2024 = 84. So the 2024 maximum is E = 90 and, with range 60, F2024 = 30.
F: \(\times 2 \times 0.75 = \times 1.5\), so F2016 = 20, F2020 = 40. 2016 range 60 gives B2016 = 80, so B2020 = 60, B2024 = 45.
F is lowest in 2020, so A2020 = 1.25A2016 > 40, i.e. A2016 > 32, so A2016 = 40. D2016 is a multiple of 5 between 20 and 40: 25, 30 or 35 (not fixed).
Reading the plot: A (25%, 50%), B (-25%, -25%), C (-20%, 40%), D (100%, 20%), E (25%, 20%), F (100%, -25%). So SI2024 = SI2016 \(\times\) (1+X)(1+Y), and every SI is an integer.
B: \(\times \tfrac{3}{4} \times \tfrac{3}{4}\), so B2016 is a multiple of 16. C: \(\times \tfrac{4}{5}\times\tfrac{7}{5}\), so C2016 is a multiple of 25.
2016 ranks B > C > E (60) > A: C2016 = 75 and B2016 = 80 or 96.
2024: A2016 < 60 and A grows by \(\times\tfrac{15}{8}\), so A2016 is a multiple of 8 and at most 48; 48 gives 90 (not allowed, only E has 90). D2016 < A2016 \(\le\) 40 gives D2024 = 2.4D2016 \(\le\) 84. C2024 = 84. So the 2024 maximum is E = 90 and, with range 60, F2024 = 30.
F: \(\times 2 \times 0.75 = \times 1.5\), so F2016 = 20, F2020 = 40. 2016 range 60 gives B2016 = 80, so B2020 = 60, B2024 = 45.
F is lowest in 2020, so A2020 = 1.25A2016 > 40, i.e. A2016 > 32, so A2016 = 40. D2016 is a multiple of 5 between 20 and 40: 25, 30 or 35 (not fixed).
Reading the plot: A (25%, 50%), B (-25%, -25%), C (-20%, 40%), D (100%, 20%), E (25%, 20%), F (100%, -25%). So SI2024 = SI2016 \(\times\) (1+X)(1+Y), and every SI is an integer.
B: \(\times \tfrac{3}{4} \times \tfrac{3}{4}\), so B2016 is a multiple of 16. C: \(\times \tfrac{4}{5}\times\tfrac{7}{5}\), so C2016 is a multiple of 25.
2016 ranks B > C > E (60) > A: C2016 = 75 and B2016 = 80 or 96.
2024: A2016 < 60 and A grows by \(\times\tfrac{15}{8}\), so A2016 is a multiple of 8 and at most 48; 48 gives 90 (not allowed, only E has 90). D2016 < A2016 \(\le\) 40 gives D2024 = 2.4D2016 \(\le\) 84. C2024 = 84. So the 2024 maximum is E = 90 and, with range 60, F2024 = 30.
F: \(\times 2 \times 0.75 = \times 1.5\), so F2016 = 20, F2020 = 40. 2016 range 60 gives B2016 = 80, so B2020 = 60, B2024 = 45.
F is lowest in 2020, so A2020 = 1.25A2016 > 40, i.e. A2016 > 32, so A2016 = 40. D2016 is a multiple of 5 between 20 and 40: 25, 30 or 35 (not fixed).
Country
2016
2020
2024
A
40
50
75
B
80
60
45
C
75
60
84
D
25/30/35
50/60/70
60/72/84
E
60
75
90
F
20
40
30
B2024 = 80 \(\times\) 0.75 \(\times\) 0.75 = 45.
Hence, the answer is (D) 45.
Anu, Bijay, Chetan, Deepak, Eshan, and Faruq are six friends. Each of them uses a mobile number from exactly one of the two mobile operators - Xitel and Yocel. During the last month, the six friends made several calls to each other. Each call was made by one of these six friends to another. The table below summarizes the number of minutes of calls that each of the six made to (outgoing minutes) and received from (incoming minutes) these friends, grouped by the operators. Some of the entries are missing.
Friend
Operator
Outgoing minutes to
Incoming minutes from
Operator Xitel
Operator Yocel
Operator Xitel
Operator Yocel
Anu
Xitel
100
50
225
Bijay
Xitel
200
125
Chetan
Yocel
50
175
250
150
Deepak
Yocel
100
150
275
100
Eshan
Yocel
100
100
375
Faruq
Yocel
0
100
150
It is known that the duration of calls from Faruq to Eshan was 200 minutes. Also, there were no calls from: i. Bijay to Eshan, ii. Chetan to Anu and Chetan to Deepak, iii. Deepak to Bijay and Deepak to Faruq, iv. Eshan to Chetan and Eshan to Deepak.
Operators: Anu, Bijay use Xitel; Chetan, Deepak, Eshan, Faruq use Yocel. So 'to/from Xitel' means to/from Anu or Bijay, and 'to/from Yocel' means to/from C, D, E, F. Write A→B for minutes of calls from A to B.
Anu's 'incoming from Xitel' is 50. The only other Xitel user is Bijay, so all of it came from Bijay: B→A = 50.
Operators: Anu, Bijay use Xitel; Chetan, Deepak, Eshan, Faruq use Yocel. So 'to/from Xitel' means to/from Anu or Bijay, and 'to/from Yocel' means to/from C, D, E, F. Write A→B for minutes of calls from A to B.
Step 1 (direct from the table and the 'no call' list): Anu's outgoing to Xitel = 100 = A→B. Chetan→Xitel = 50 and C→A = 0, so C→B = 50. Deepak→Xitel = 100 and D→B = 0, so D→A = 100. Eshan→Yocel = 100 and E→C = E→D = 0, so E→F = 100. Faruq→Xitel = 0, so F→A = F→B = 0. Given F→E = 200. Anu's incoming from Xitel = 50 = B→A. Eshan's incoming from Xitel = 100 and B→E = 0, so A→E = 100.
(The '?' cells are not individually fixed, but A→C + B→C = 250, A→D + B→D = 275, A→F + B→F = 100 from the incoming-from-Xitel column, and B→C + B→D + B→F = 200.)
Operators: Anu, Bijay use Xitel; Chetan, Deepak, Eshan, Faruq use Yocel. So 'to/from Xitel' means to/from Anu or Bijay, and 'to/from Yocel' means to/from C, D, E, F. Write A→B for minutes of calls from A to B.
Step 1 (direct from the table and the 'no call' list): Anu's outgoing to Xitel = 100 = A→B. Chetan→Xitel = 50 and C→A = 0, so C→B = 50. Deepak→Xitel = 100 and D→B = 0, so D→A = 100. Eshan→Yocel = 100 and E→C = E→D = 0, so E→F = 100. Faruq→Xitel = 0, so F→A = F→B = 0. Given F→E = 200. Anu's incoming from Xitel = 50 = B→A. Eshan's incoming from Xitel = 100 and B→E = 0, so A→E = 100.
(The '?' cells are not individually fixed, but A→C + B→C = 250, A→D + B→D = 275, A→F + B→F = 100 from the incoming-from-Xitel column, and B→C + B→D + B→F = 200.)
Operators: Anu, Bijay use Xitel; Chetan, Deepak, Eshan, Faruq use Yocel. So 'to/from Xitel' means to/from Anu or Bijay, and 'to/from Yocel' means to/from C, D, E, F. Write A→B for minutes of calls from A to B.
Step 1 (direct from the table and the 'no call' list): Anu's outgoing to Xitel = 100 = A→B. Chetan→Xitel = 50 and C→A = 0, so C→B = 50. Deepak→Xitel = 100 and D→B = 0, so D→A = 100. Eshan→Yocel = 100 and E→C = E→D = 0, so E→F = 100. Faruq→Xitel = 0, so F→A = F→B = 0. Given F→E = 200. Anu's incoming from Xitel = 50 = B→A. Eshan's incoming from Xitel = 100 and B→E = 0, so A→E = 100.
(The '?' cells are not individually fixed, but A→C + B→C = 250, A→D + B→D = 275, A→F + B→F = 100 from the incoming-from-Xitel column, and B→C + B→D + B→F = 200.)
D→C = 100 minutes.
Hence, the answer is (C) 100.
Three countries — Pumpland (P), Xiland (X) and Cheeseland (C) — trade among themselves and with the (other countries in) Rest of World (ROW). All trade volumes are given in IC (international currency). The following terminology is used: • Trade balance = Exports – Imports • Total trade = Exports + Imports • Normalized trade balance = Trade balance / Total trade, expressed in percentage terms
The following information is known. 1. The normalized trade balances of P, X and C are 0%, 10%, and –20%, respectively. 2. 40% of exports of X are to P. 22% of imports of P are from X. 3. 90% of exports of C are to P; 4% are to ROW. 4. 12% of exports of ROW are to X, 40% are to P. 5. The export volumes of P, in IC, to X and C are 600 and 1200, respectively. P is the only country that exports to C.
C: P is the only exporter to C, so C's imports = 1200. Normalized balance −20%: \(\frac{E_C - 1200}{E_C + 1200} = -0.2 \Rightarrow E_C = 800\). C exports 90% = 720 to P, 4% = 32 to ROW, and the remaining 6% = 48 to X.
Let ROW's total exports = \(R\) (12% to X, 40% to P, nothing to C, so 48% to ROW itself), X's exports = \(E_X\) (40% to P, rest 60% to ROW), P's imports = \(I_P\).
P's imports: \(I_P = 0.22I_P + 720 + 0.4R \Rightarrow 0.78I_P = 720 + 0.4R\). X to P: \(0.4E_X = 0.22I_P \Rightarrow E_X = 0.55I_P\). X's imports = 600 + 48 + 0.12R; balance 10% gives \(0.9E_X = 1.1I_X\), so \(E_X = \frac{11}{9}(648 + 0.12R)\). Equating: \(\frac{0.55(720 + 0.4R)}{0.78} = \frac{11}{9}(648 + 0.12R) \Rightarrow 3564 + 1.98R = 5559.84 + 1.0296R \Rightarrow R = 2100\). Then \(I_P = 1560/0.78 = 2000\), \(E_X = 1100\), \(I_X = 900\). P's balance is 0, so P's exports = 2000 = 600 + 1200 + (P to ROW), giving P to ROW = 200.
C: P is the only exporter to C, so C's imports = 1200. Normalized balance −20%: \(\frac{E_C - 1200}{E_C + 1200} = -0.2 \Rightarrow E_C = 800\). C exports 90% = 720 to P, 4% = 32 to ROW, and the remaining 6% = 48 to X.
Let ROW's total exports = \(R\) (12% to X, 40% to P, nothing to C, so 48% to ROW itself), X's exports = \(E_X\) (40% to P, rest 60% to ROW), P's imports = \(I_P\).
P's imports: \(I_P = 0.22I_P + 720 + 0.4R \Rightarrow 0.78I_P = 720 + 0.4R\). X to P: \(0.4E_X = 0.22I_P \Rightarrow E_X = 0.55I_P\). X's imports = 600 + 48 + 0.12R; balance 10% gives \(0.9E_X = 1.1I_X\), so \(E_X = \frac{11}{9}(648 + 0.12R)\). Equating: \(\frac{0.55(720 + 0.4R)}{0.78} = \frac{11}{9}(648 + 0.12R) \Rightarrow 3564 + 1.98R = 5559.84 + 1.0296R \Rightarrow R = 2100\). Then \(I_P = 1560/0.78 = 2000\), \(E_X = 1100\), \(I_X = 900\). P's balance is 0, so P's exports = 2000 = 600 + 1200 + (P to ROW), giving P to ROW = 200.
C: P is the only exporter to C, so C's imports = 1200. Normalized balance −20%: \(\frac{E_C - 1200}{E_C + 1200} = -0.2 \Rightarrow E_C = 800\). C exports 90% = 720 to P, 4% = 32 to ROW, and the remaining 6% = 48 to X.
Let ROW's total exports = \(R\) (12% to X, 40% to P, nothing to C, so 48% to ROW itself), X's exports = \(E_X\) (40% to P, rest 60% to ROW), P's imports = \(I_P\).
P's imports: \(I_P = 0.22I_P + 720 + 0.4R \Rightarrow 0.78I_P = 720 + 0.4R\). X to P: \(0.4E_X = 0.22I_P \Rightarrow E_X = 0.55I_P\). X's imports = 600 + 48 + 0.12R; balance 10% gives \(0.9E_X = 1.1I_X\), so \(E_X = \frac{11}{9}(648 + 0.12R)\). Equating: \(\frac{0.55(720 + 0.4R)}{0.78} = \frac{11}{9}(648 + 0.12R) \Rightarrow 3564 + 1.98R = 5559.84 + 1.0296R \Rightarrow R = 2100\). Then \(I_P = 1560/0.78 = 2000\), \(E_X = 1100\), \(I_X = 900\). P's balance is 0, so P's exports = 2000 = 600 + 1200 + (P to ROW), giving P to ROW = 200.
C: P is the only exporter to C, so C's imports = 1200. Normalized balance −20%: \(\frac{E_C - 1200}{E_C + 1200} = -0.2 \Rightarrow E_C = 800\). C exports 90% = 720 to P, 4% = 32 to ROW, and the remaining 6% = 48 to X.
Let ROW's total exports = \(R\) (12% to X, 40% to P, nothing to C, so 48% to ROW itself), X's exports = \(E_X\) (40% to P, rest 60% to ROW), P's imports = \(I_P\).
P's imports: \(I_P = 0.22I_P + 720 + 0.4R \Rightarrow 0.78I_P = 720 + 0.4R\). X to P: \(0.4E_X = 0.22I_P \Rightarrow E_X = 0.55I_P\). X's imports = 600 + 48 + 0.12R; balance 10% gives \(0.9E_X = 1.1I_X\), so \(E_X = \frac{11}{9}(648 + 0.12R)\). Equating: \(\frac{0.55(720 + 0.4R)}{0.78} = \frac{11}{9}(648 + 0.12R) \Rightarrow 3564 + 1.98R = 5559.84 + 1.0296R \Rightarrow R = 2100\). Then \(I_P = 1560/0.78 = 2000\), \(E_X = 1100\), \(I_X = 900\). P's balance is 0, so P's exports = 2000 = 600 + 1200 + (P to ROW), giving P to ROW = 200.
Exporter \ Importer
P
X
C
ROW
Total exports
P
-
600
1200
200
2000
X
440
-
0
660
1100
C
720
48
-
32
800
ROW
840
252
0
1008
2100
Total imports
2000
900
1200
1900
ROW's exports = 2100, imports = 200 (from P) + 660 (from X) + 32 (from C) + 1008 (from ROW) = 1900. Trade balance = 2100 − 1900 = 200 (the same if the 1008 internal trade is left out of both sides: 1092 − 892).
C: P is the only exporter to C, so C's imports = 1200. Normalized balance −20%: \(\frac{E_C - 1200}{E_C + 1200} = -0.2 \Rightarrow E_C = 800\). C exports 90% = 720 to P, 4% = 32 to ROW, and the remaining 6% = 48 to X.
Let ROW's total exports = \(R\) (12% to X, 40% to P, nothing to C, so 48% to ROW itself), X's exports = \(E_X\) (40% to P, rest 60% to ROW), P's imports = \(I_P\).
P's imports: \(I_P = 0.22I_P + 720 + 0.4R \Rightarrow 0.78I_P = 720 + 0.4R\). X to P: \(0.4E_X = 0.22I_P \Rightarrow E_X = 0.55I_P\). X's imports = 600 + 48 + 0.12R; balance 10% gives \(0.9E_X = 1.1I_X\), so \(E_X = \frac{11}{9}(648 + 0.12R)\). Equating: \(\frac{0.55(720 + 0.4R)}{0.78} = \frac{11}{9}(648 + 0.12R) \Rightarrow 3564 + 1.98R = 5559.84 + 1.0296R \Rightarrow R = 2100\). Then \(I_P = 1560/0.78 = 2000\), \(E_X = 1100\), \(I_X = 900\). P's balance is 0, so P's exports = 2000 = 600 + 1200 + (P to ROW), giving P to ROW = 200.
Exporter \ Importer
P
X
C
ROW
Total exports
P
-
600
1200
200
2000
X
440
-
0
660
1100
C
720
48
-
32
800
ROW
840
252
0
1008
2100
Total imports
2000
900
1200
1900
Total trade: P = 2000 + 2000 = 4000, X = 1100 + 900 = 2000, C = 800 + 1200 = 2000. X and C tie for the least.
Hence, the answer is (A) Both X and C.
Answer the following questions based on the information given below.
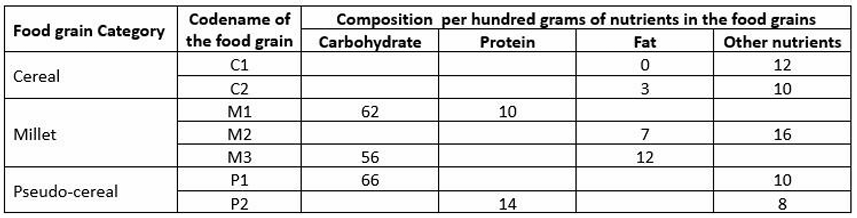
The table given below shows the amount, in grams, of carbohydrate, protein, fat and all other nutrients, per 100 grams of nutrients in seven foodgrains. The first column shows the foodgrain category and the second column its odename. The table has some missing values.
The following additional facts are known.
1. Both the pseudo-cereals had higher amounts of carbohydrate as well as higher amounts of protein than any millet.
2. Both the cereals had higher amounts of carbohydrate than any pseudo-cereal.
3. All the missing values of carbohydrate amounts (in grams) for all the foodgrains are non-zero multiples of 5.
4. All the missing values of protein, fat and other nutrients amounts (in grams) for all the foodgrains are non-zero multiples of 4.
5. P1 contained double the amount of protein that M3 contains.
Each row adds up to 100. Missing carbohydrate values are multiples of 5; other missing values are multiples of 4.
P1 and M3: P1 has protein + fat = 24, so P1 protein ≤ 20. It equals 2 × M3 protein, which is a multiple of 8: either 8 or 16. It must also exceed M1's protein of 10 (fact 1). So P1 protein = 16 and P1 fat = 8. Then M3 protein = 8 and M3 other = 100 − 56 − 8 − 12 = 24.
P2: carbohydrate + fat = 78. Its carbohydrate must exceed every millet (at least 62). The options are 70 + 8 or 50 + 28, and only 70 + 8 is large enough. So P2 carbohydrate = 70, fat = 8.
M2: carbohydrate + protein = 77. The options are 65 + 12, 45 + 32, and so on. Its protein must be below 14 (P2's protein), so M2 = 65 carbohydrate, 12 protein. This also keeps it below P1's 66.
C1: carbohydrate + protein = 88, with carbohydrate above 70 (fact 2): 80 + 8. (75 + 13 fails, since 13 is not a multiple of 4.)
Each row adds up to 100. Missing carbohydrate values are multiples of 5; other missing values are multiples of 4.
P1 and M3: P1 has protein + fat = 24, so P1 protein ≤ 20. It equals 2 × M3 protein, which is a multiple of 8: either 8 or 16. It must also exceed M1's protein of 10 (fact 1). So P1 protein = 16 and P1 fat = 8. Then M3 protein = 8 and M3 other = 100 − 56 − 8 − 12 = 24.
P2: carbohydrate + fat = 78. Its carbohydrate must exceed every millet (at least 62). The options are 70 + 8 or 50 + 28, and only 70 + 8 is large enough. So P2 carbohydrate = 70, fat = 8.
M2: carbohydrate + protein = 77. The options are 65 + 12, 45 + 32, and so on. Its protein must be below 14 (P2's protein), so M2 = 65 carbohydrate, 12 protein. This also keeps it below P1's 66.
C1: carbohydrate + protein = 88, with carbohydrate above 70 (fact 2): 80 + 8. (75 + 13 fails, since 13 is not a multiple of 4.)
Each row adds up to 100. Missing carbohydrate values are multiples of 5; other missing values are multiples of 4.
P1 and M3: P1 has protein + fat = 24, so P1 protein ≤ 20. It equals 2 × M3 protein, which is a multiple of 8: either 8 or 16. It must also exceed M1's protein of 10 (fact 1). So P1 protein = 16 and P1 fat = 8. Then M3 protein = 8 and M3 other = 100 − 56 − 8 − 12 = 24.
P2: carbohydrate + fat = 78. Its carbohydrate must exceed every millet (at least 62). The options are 70 + 8 or 50 + 28, and only 70 + 8 is large enough. So P2 carbohydrate = 70, fat = 8.
M2: carbohydrate + protein = 77. The options are 65 + 12, 45 + 32, and so on. Its protein must be below 14 (P2's protein), so M2 = 65 carbohydrate, 12 protein. This also keeps it below P1's 66.
C1: carbohydrate + protein = 88, with carbohydrate above 70 (fact 2): 80 + 8. (75 + 13 fails, since 13 is not a multiple of 4.)
Each row adds up to 100. Missing carbohydrate values are multiples of 5; other missing values are multiples of 4.
P1 and M3: P1 has protein + fat = 24, so P1 protein ≤ 20. It equals 2 × M3 protein, which is a multiple of 8: either 8 or 16. It must also exceed M1's protein of 10 (fact 1). So P1 protein = 16 and P1 fat = 8. Then M3 protein = 8 and M3 other = 100 − 56 − 8 − 12 = 24.
P2: carbohydrate + fat = 78. Its carbohydrate must exceed every millet (at least 62). The options are 70 + 8 or 50 + 28, and only 70 + 8 is large enough. So P2 carbohydrate = 70, fat = 8.
M2: carbohydrate + protein = 77. The options are 65 + 12, 45 + 32, and so on. Its protein must be below 14 (P2's protein), so M2 = 65 carbohydrate, 12 protein. This also keeps it below P1's 66.
C1: carbohydrate + protein = 88, with carbohydrate above 70 (fact 2): 80 + 8. (75 + 13 fails, since 13 is not a multiple of 4.)
M1: fat + other = 28. This split is not fixed and is not needed.
Grain
Carb
Protein
C1
80
8
C2
75
12
M1
62
10
M2
65
12
M3
56
8
P1
66
16
P2
70
14
Proteins in order: 8, 8, 10, 12, 12, 14, 16. The middle (4th) value is 12.
Answer: 12
Answer the next 4 questions based on the information given below.
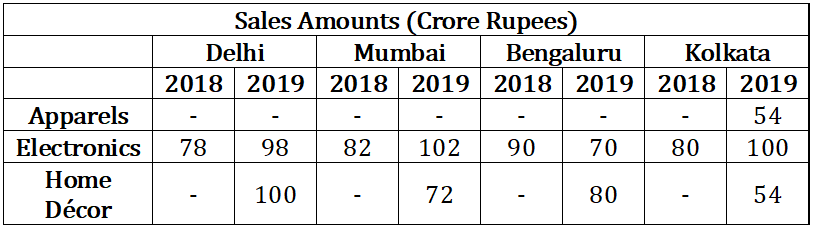
A chain of departmental stores has outlets in Delhi, Mumbai, Bengaluru and Kolkata. The sales are categorized by its three departments – ‘Apparel’, ‘Electronics’, and ‘HomeDecor’. An Accountant has been asked to prepare a summary of the 2018 and 2019 sales amounts for an internal report. He has collated partial information and prepared the following table.
The following additional information is known.
The sales amounts in the Apparel departments were the same for Delhi and Kolkata in 2018.
The sales amounts in the Apparel departments were the same for Mumbai and Bengaluru in 2018. This sales amount matched the sales amount in the Apparel department for Delhi in 2019.
The sales amounts in the HomeDecor departments were the same for Mumbai and Kolkata in 2018.
The sum of the sales amounts of four Electronics departments increased by the same amount as the sum of the sales amounts of four Apparel departments from 2018 to 2019.
The total sales amounts of the four HomeDecor departments increased by Rs 70 Crores from 2018 to 2019.
The sales amounts in the HomeDecor departments of Delhi and Bengaluru each increased by Rs 20 Crores from 2018 to 2019.
The sales amounts in the Apparel departments of Delhi and Bengaluru each increased by the same amount in 2019 from 2018. The sales amounts in the Apparel departments of Mumbai and Kolkata also each increased by the same amount in 2019 from 2018.
The sales amounts in the Apparel departments of Delhi, Kolkata and Bengaluru in 2019 followed an Arithmetic
The sales amounts in the Home Decor departments of Delhi and Bengaluru each increased by Rs 20 Crores from 2018 to 2019.
∴ Delhi (2018) = 100 – 20 = 80
Bengaluru (2018) = 80 – 20 = 60
The sales amounts in the Home Decor departments were the same for Mumbai and Kolkata in 2018.
Let Mumbai (2018) = Kolkata (2018) = a
∴ Data for Home Décor will be as follows
The total sales amounts of the four HomeDecor departments increased by Rs 70 Crores from 2018 to 2019.
∴ (80 + a + 60 + a) + 70 = (100 + 72 + 80 + 54)
⇒ 2a + 210 = 306
⇒ a = 48
Apparels:
The sales amounts in the Apparel departments were the same for Delhi and Kolkata in 2018.
Let Delhi (2018) = Kolkata (2018) = b
The sales amounts in the Apparel departments were the same for Mumbai and Bengaluru in 2018. This sales amount matched the sales amount in the Apparel department for Delhi in 2019.
Let Mumbai (2018) = Bengaluru (2018) = Delhi (2019) = c
The sales amounts in the Apparel departments of Delhi and Bengaluru each increased by the same amount in 2019 from 2018. The sales amounts in the Apparel departments of Mumbai and Kolkata also each increased by the same amount in 2019 from 2018.
∴ Bengaluru (2019) = c + (c – b) = 2c – b
Also, Mumbai (2019) = c + (54 - b) = c – b + 54
The sales amounts in the Apparel departments of Delhi, Kolkata and Bengaluru in 2019 followed an Arithmetic Progression.
∴ Delhi – Kolkata = Kolkata – Bengaluru
⇒ Delhi + Bengaluru = 2 × Kolkata
⇒ c + 2c – b = 2 × 54
3c – b = 108 …(1)
The sum of the sales amounts of four Electronics departments increased by the same amount as the sum of the sales amounts of four Apparel departments from 2018 to 2019.
From 2018 to 2019, total increase in apparels sales = Total increase in Electronics sales
∴ [c + (c – b + 54) + (2c - b) + 54] – [b + c + c + b] = [98 + 102 + 70 + 100] – [78 + 82 + 90 + 80]
⇒ [4c – 2b + 108] – [2b + 2c] = 370 – 330
⇒ c – 2b = -34 …(2)
Solving (1) and (2) we get,
b = 42 and c = 50 …(3)
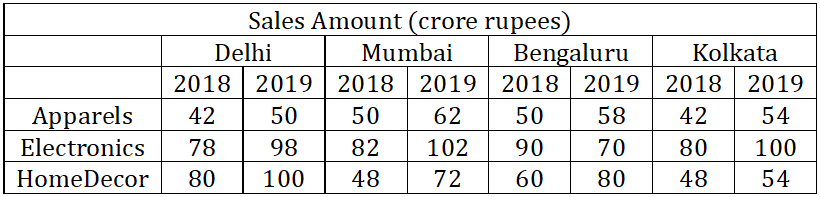
∴ We can make the following table
For HomeDecor highest sales in 2018 as well as in 2019 was in Delhi.
Among all the 12 departments (i.e., the 3 departments in each of the 4 cities), what was the maximum percentage increase in sales amount from 2018 to 2019?