

Q40
How many instances are there in the graph where the difference in sale of refrigrators was greater or lesser by 35% or more as compared to the previous year?
Answer: B
A written solution for this question isn't available yet.
Answer it first: the answer and the solution appear right after.
Questions on this set: Q36 Q37 Q38 Q39 Q40
Study the graph to answer these questions.
The graph below shows sales of different colour of Brand-X refrigerator for the year 2009, 2010 and 2011.
Brand-X: Sales volume by colour of refrigrator(in '000s)
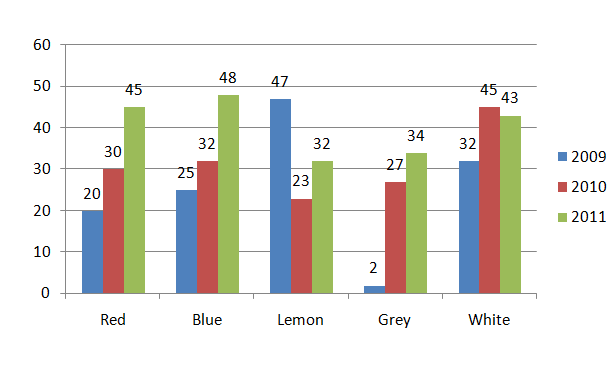
How many instances are there in the graph where the difference in sale of refrigrators was greater or lesser by 35% or more as compared to the previous year?
Answer: B
A written solution for this question isn't available yet.