

MAT · 2012 · Question 2 of 40

MAT 2012 DAS Slot 1 Question 2

Answer it first: the answer and the solution appear right after.

Questions on this set: Q1 Q2 Q3 Q4 Q5

Study the graph to answer these questions.
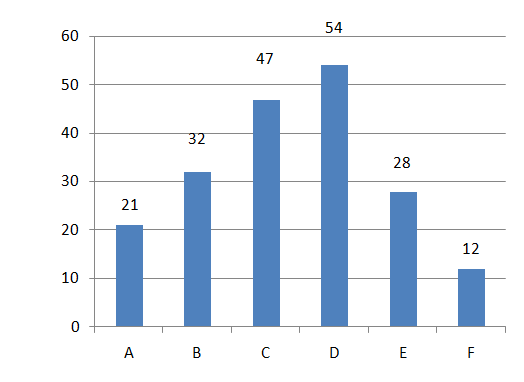
The bar graph below shows the sales of six different cell phone manufacturers in 2011 (in '000units).
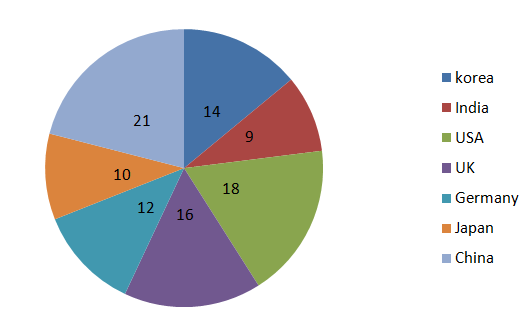
The Adjoining pie chart shows the breakeup of brand C alone in the same year for those countries where it is sold.
                                            

                                               2011 Global Sales ('000s)

          Brand 'C' Country-wise sales

Q2 MULTIPLE CHOICE

By what percentage should global sales of 'C' phone increase, so that its sales volume in korea becomes 7000 units, while the volume of sales to all other countries remains the same?