

Q35
In which states is the difference between the number of Engg. and IT graduates higher than the differece between the number of Science and Arts graduates?
Answer: D
A written solution for this question isn't available yet.
Answer it first: the answer and the solution appear right after.
Questions on this set: Q31 Q32 Q33 Q34 Q35
Study the graph to answer these questions.
The graph below shows the number of graduates (in '000) of different streams, in six different states of country.
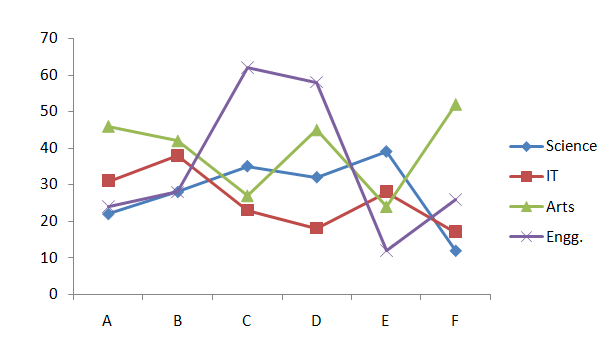
In which states is the difference between the number of Engg. and IT graduates higher than the differece between the number of Science and Arts graduates?
Answer: D
A written solution for this question isn't available yet.