

Q27
Which of the following earned the least amount of money for the investment portfolio?
Answer: D
A written solution for this question isn't available yet.
Answer it first: the answer and the solution appear right after.
Questions on this set: Q25 Q26 Q27 Q28
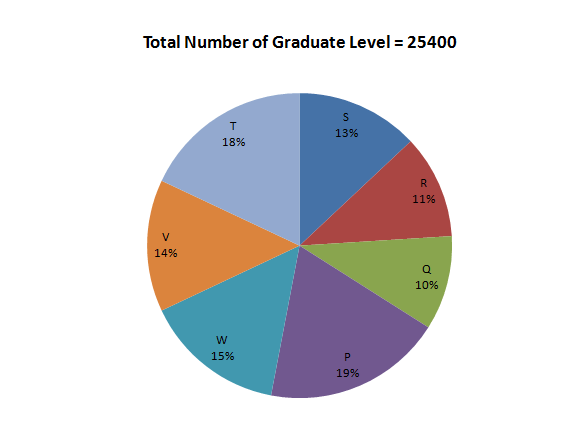
Directions: The following pie-charts show the distribution of students of graduate and post-graduate levels in seven different institutes namely P, Q, R, S, T, V, and W.

Which of the following earned the least amount of money for the investment portfolio?
Answer: D
A written solution for this question isn't available yet.