

Q1
How much did the salesman earn from the sale of 3 cars?
(A) Each car sold for Rs 3,40,000
(B) He received a 2% commission on each sale.
Answer: A
A written solution for this question isn't available yet.
Click an option to answer, or type your answer for TITA questions. The answer key and solution appear right after. Written solutions: 0 of 40.
Each of the Question ns below is followed by two statements, labelled (A) and (B). Decide whether the data given in the statements is sufficient for answering the question.
Mark answer as
How much did the salesman earn from the sale of 3 cars?
(A) Each car sold for Rs 3,40,000
(B) He received a 2% commission on each sale.
Answer: A
A written solution for this question isn't available yet.
What does WXY equal?
(A) W=X+Y
(B) WXYZ = 6Z
Answer: B
A written solution for this question isn't available yet.
Which number is greatest C, D or E?
(A) 2D > 2E > 2C
(B) C + 2 = D > E
Answer: C
A written solution for this question isn't available yet.
If Sanjay can paint a house in 15 hours working alone, how long will it take to paint the house if Mohit helps him?
(A) Mohit can paint the house in 20 hours working alone.
(B) Working together with Sanjay, Mohit does 3/7 of the total work.
Answer: D
A written solution for this question isn't available yet.
In each of these Question two quantities are given, one in column A and one in column B.
Compare the two quantities.
Given Information
x = -2
Column A
\(3x^2 + 2x - 1\)
Column B
\(x^3 + 2x^2 + 1\)
Answer: C
A written solution for this question isn't available yet.
Given Information
\(\frac{a}{a + b} = \frac{c}{c + d}\)
Column A
cb
Column B
ad
Answer: A
A written solution for this question isn't available yet.
Given Information
An audio cassette priced at Rs 47.25 includes a 5% mark-up mark-up
Column A
Rs.44.89 price before mark-up
Column B
The original
Answer: B
A written solution for this question isn't available yet.
Given Information
25% of the 300 girls in our school wear spectacles do not
Column A
The ratio of girls wearing to those who do not.
Column B
1 : 3
Answer: A
A written solution for this question isn't available yet.
Refer to tint following line graph which represents the rainfall in inches during the months of January through July in a particular year in a certain city.
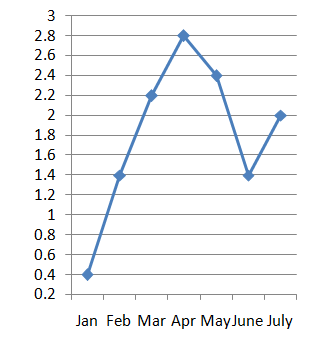
In each of those Question ns two quantities are given, one in column A and one in column b. Compare the two quantities.
Column A
The ratio of rainfall between the months February and July
Column B
2 : 3
Answer: C
A written solution for this question isn't available yet.
Column A
The average monthly rainfall recorded for the 7 months
Column B
1.9 inches
Answer: B
A written solution for this question isn't available yet.
Column A
12½% of all the rain that fell during the 7 month period
Column B
The amount of rainfall during Rainfall during the month of February.
Answer: C
A written solution for this question isn't available yet.
Column A
The ratio between average rainfall in average rainfall in May and January
Column B
The ratio between the average rainfall in April and February
Answer: C
A written solution for this question isn't available yet.
Study the table to answer these questions.
Table - Number of cancer cases over two years for selected countries.
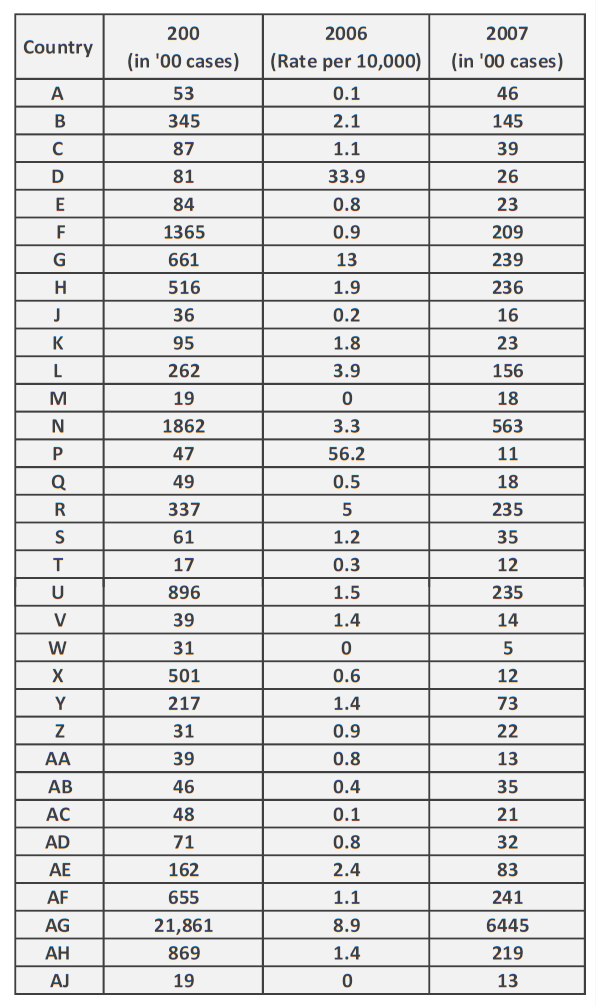
All countries that have reported more than five hundred cancer to the WHO in 2007 are listed here. The left column gives the total number of cases reported by each country for 2006, the middle column gives the 2006 rate (cancer cases per 10,000 population) and the last column shows the number of cases reported in early 2007.
Most of the 2007 reports were for only the first quarter of the year. Owing to reporting delays of six months or more, cases reported in 2007 actually were diagnosed in 2006.
What is the population of AD on the basis of the reported cases of cancer in 2006 (in thousands)?
Answer: D
A written solution for this question isn't available yet.
Which country has reported the second highest number of cancer cases to WHO during 2006?
Answer: A
A written solution for this question isn't available yet.
The countries which have reported less than 2000 cases both the 2006 and early 2007 are
Answer: D
A written solution for this question isn't available yet.
Which of the following are true from the table?
I. The reported cancer cases of M, Wand AJ as compare to their population are negligible.
II. The 2006 rate is highest for P though the reported cases are only 4700.
III. The population of R is 664,000 in 2006.
IV. P reported more than 20,000 cases of cancer in early 2007
Answer: C
A written solution for this question isn't available yet.
Refer to the following Tables (A) and (B) to answer these questions.
Table A: Production of Inorganic Chemicals
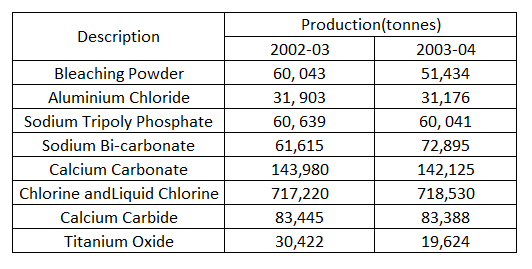
Table B: Production of Organic Chemicals
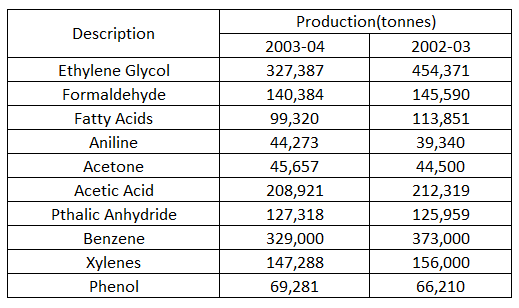
The ratio of the number of organic chemicals for which the production has fallen to the number of inorganic chemicals for which production has fallen is
Answer: A
A written solution for this question isn't available yet.
Of all chemicals shown, the highest percentage increase in production has been exhibited for
Answer: D
A written solution for this question isn't available yet.
The chemical, whose production in 2003 - 04 as a proportion of its total production for the two-year period was the lowest, is
Answer: D
A written solution for this question isn't available yet.
If productive volatility is defined as the percentage change in production, and it is known that any chemical whose productive volatility is greater than 5% is classified as highly volatile, then how many chemicals are not highly volatile (amongst organic chemicals)
Answer: B
A written solution for this question isn't available yet.
Consider the following graph where the prices of timber are given, for the period 1997- 2003. The prices for plywood and sawn timber are given in Rs. 1 ton while the price of logs is given in Rs per cubic meter. Assume 1 ton is equal to 1,000 kg and one cubic meter of Log weighs 800 kg.
Timber Product Prices
prices
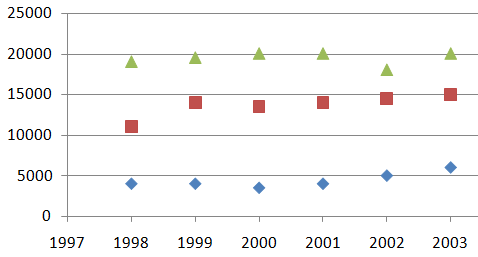
years
Which product had the largest percentage increase in price per cubic meter over the 7-year period?
Answer: B
A written solution for this question isn't available yet.
The maximum increase in price per cubic metre for any product over any two successive years was
Answer: A
A written solution for this question isn't available yet.
In 2003, the total sales of the company measured in cubic metres was made up of 40% plywood, 30% sawn timber and 30% logs. The average realisation per cubic metre in 2003 was closest to
Answer: C
A written solution for this question isn't available yet.
In 2004, the prices of plywood, sawn timber and logs went up by 5%, 1% and 10%, respectively, and the total sales were made up of 40% plywood, 30% sawn timber and 30% logs. The average realisation per cubic metre in 2004 was closest to
Answer: B
A written solution for this question isn't available yet.
Directions: The following pie-charts show the distribution of students of graduate and post-graduate levels in seven different institutes namely P, Q, R, S, T, V, and W.
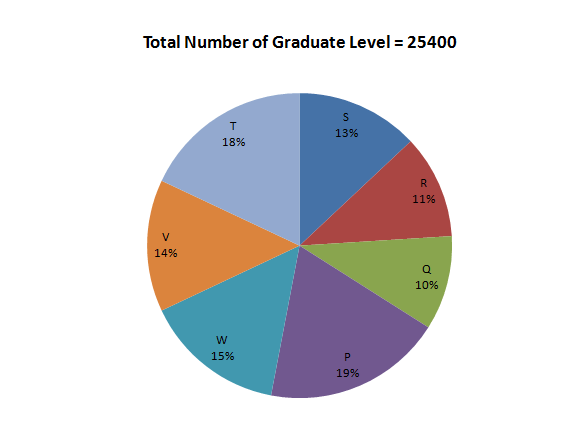

According to these graphs, approximately, how much money from the investment portfolio was invested in high-risk stocks?
Answer: A
A written solution for this question isn't available yet.
Approximately how much money belonging to the investment portfolio was invested in State-issued bonds?
Answer: D
A written solution for this question isn't available yet.
Which of the following earned the least amount of money for the investment portfolio?
Answer: D
A written solution for this question isn't available yet.
Which of the following was the greatest?
Answer: C
A written solution for this question isn't available yet.
Directions: Study the graphs to answer this question. In an election, if no single candidate secures a simple majority of 50% in the first round, then the top five candidates in terms of votes polled proceed to the next round. If no one still gets a simple majority, then the top three of that round go into the next round. If the decision is still not decisive in favor of one candidate, only the top two proceed to the last round. The following pie charts show the results of the elections.
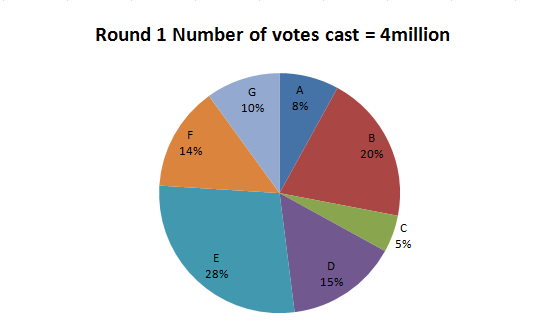
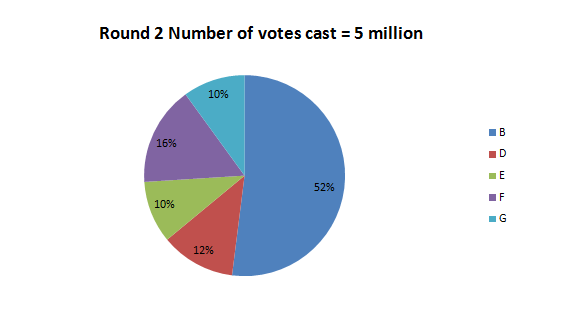
Which of the five states has the highest percentage of readers of Hindi newspapers?
Answer: A
A written solution for this question isn't available yet.
From the data provided above we can infer that
Answer: C
A written solution for this question isn't available yet.
If UP has 25,00,000 newspaper readers and Rajasthan has 15,00,000, how many more readers buy English newspapers in UP than in Rajasthan (approximately)?
Answer: C
A written solution for this question isn't available yet.
About what percentage of readers in Rajasthan read Urdu newspapers?
Answer: A
A written solution for this question isn't available yet.
Study the following pie chart in respect of a library to answer these questions.

What was the percentage increase in the number of employees of the company from 1995-96 to 1997 -98?
Answer: D
A written solution for this question isn't available yet.
What was the average number of employees who worked in the company over the given years?
Answer: A
A written solution for this question isn't available yet.
What was the difference between the average of the total salaries paid by the company over the given years and the total salary paid by the company in the year 1997 -98?
Answer: A
A written solution for this question isn't available yet.
The total expenditure of the company in 1995-96 was approximately what per cent of the average of the total expenditures of the company over the given years?
Answer: D
A written solution for this question isn't available yet.
Study the following pie-charts carefully to answer these questions.
Percentage of Students in a College, Studying Various Subjects and the Percentage of Girls out of these
Total students: 1800 (1200 girls + 600 boys) Percentage of students in various subjects

Total Girls : 1200
Percentage of students in various subjects
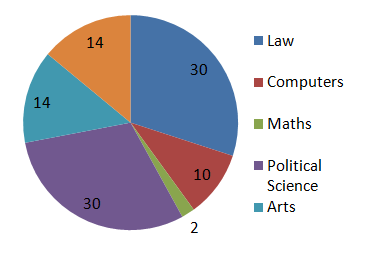
The number of girls studying art in college is
Answer: B
A written solution for this question isn't available yet.
For which subject is the number of boys the minimum?
Answer: A
A written solution for this question isn't available yet.
For Political Science, what is the respective ratio of boys and girls?
Answer: B
A written solution for this question isn't available yet.
The number of girls studying art is what per cent more than the number of boys studying art?
Answer: D
A written solution for this question isn't available yet.