

Q21
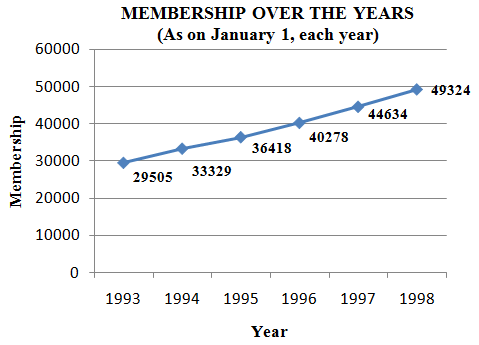
The average growth of membership per year is
Answer: B
A written solution for this question isn't available yet.
Answer it first: the answer and the solution appear right after.
Questions on this passage: Q17 Q18 Q19 Q20 Q21
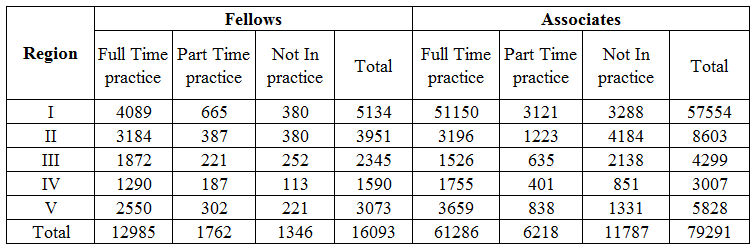
The data in the following table and graph pertains to the Fellow and Associate categories of professionals. Study the data and line graph given below to answer these Questions:
Number of branches in each region
I. Western Region — 14
II. Southern Region — 26
III. Eastern region — 3
IV. Central Region — 17
V. Northern Region — 7
The average growth of membership per year is
Answer: B
A written solution for this question isn't available yet.