

Q13
The 2002 decline in Crunchy Chicken receipts may be attributed to the
Answer: C
A written solution for this question isn't available yet.
Answer it first: the answer and the solution appear right after.
Questions on this passage: Q11 Q12 Q13
The following graph represents the Gross Receipts of three fast food restaurants from 2000-2002. Use it to answer these questions:
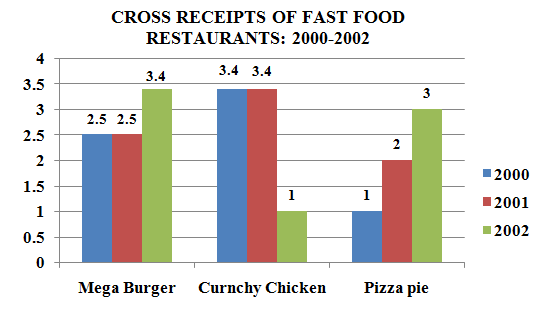
The 2002 decline in Crunchy Chicken receipts may be attributed to the
Answer: C
A written solution for this question isn't available yet.