

CAT · 2021 · Question 5 of 20

CAT 2021 LRDI Slot 1 Question 5 · DI - Charts & Tables

Answer it first: the answer and the solution appear right after.

Questions on this set: Q5 Q6 Q7 Q8

Answer the next 4 questions based on the information given 

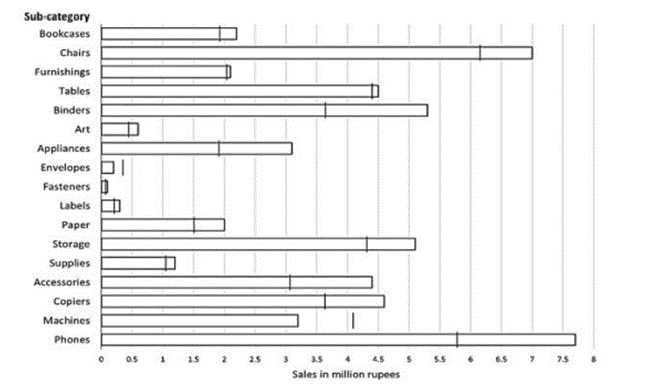
The horizontal bars in the above diagram represent 2020 aggregate sales (in ₹ million) of a company for the different subcategories of its products. The top four product subcategories (Bookcases, Chairs, Furnishings, Tables) belong to furniture product category; the bottom four product subcategories (Accessories, Copiers, Machines, Phones) belong to the technology product category while all other product subcategories belong to the office supply product category. For each of the product subcategories, there is a vertical line indicating the sales of the corresponding subcategory in 2019.

​​​​​​​
 

Q5 DI - Charts & Tables MULTIPLE CHOICE

The total sales (in ₹ million) in 2019 from products in office supplies category is closest to

→Daily Share Price Variability (SPV) is defined as (Day’s high price - Day’s low price) / (Average of the open…CAT 2024 LRDI Slot 1 →How many days between Sep 1 and Sep 14 (both inclusive) had no booking from this client considering all the a…CAT 2021 LRDI Slot 2 →Which of the following statements is/are true? I: The total project-month was the same for the four employees…CAT 2021 LRDI Slot 3 →On which aspect is the median score of the five vendors the least?CAT 2019 LRDI Slot 1