
CAT · 1997 · Question 17 of 40

CAT 1997 LRDI Question 17 · DI - Charts & Tables

Answer it first: the answer and the solution appear right after.

Questions on this set: Q16 Q17 Q18 Q19 Q20 Q21

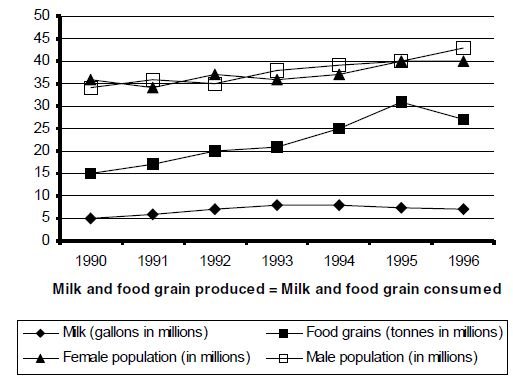
Direction: Answer the questions based on the following graph.

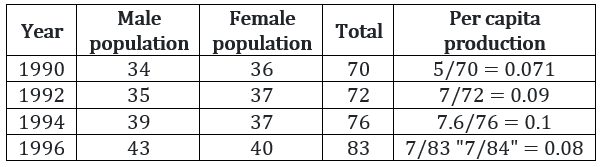
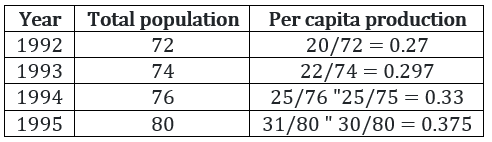
The graph given below shows the quantity of milk and food grains consumed annually along with female and male population (in millions). Use the data to answer the questions that follow.

Q17 DI - Charts & Tables MULTIPLE CHOICE

When was the per capita production of foodgrains most?

→How much is Japan's export to India worth?CAT 2025 LRDI Slot 1 →Who had solved the largest number of puzzles by the 20-th minute from the start of the competition?CAT 2025 LRDI Slot 3 →Daily Share Price Variability (SPV) is defined as (Day’s high price - Day’s low price) / (Average of the open…CAT 2024 LRDI Slot 1 →Assume that the annual rate of growth in PAT over the previous year (ARG) remained constant over the years fo…CAT 2024 LRDI Slot 2