

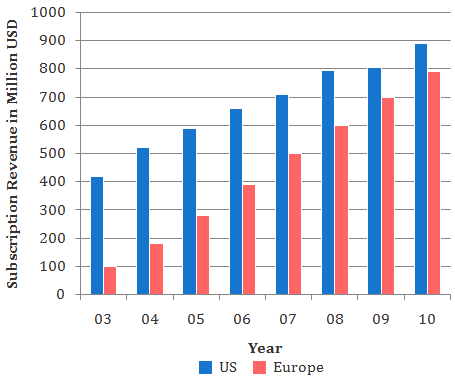
In 2003, sixty percent of subscribers in Europe were men. Given that woman subscribers increase at the rate of 10 percent per annum and men at the rate of 5 percent per annum, what is the approximate percentage growth of subscribers between 2003 and 2010 in Europe? The subscription prices are volatile and may change each year.
Answer: A
Let the number of men subscribers in 2003 be m, and the number of women subscribers in 2003 be w.
It is given that the women subscribers increase at the rate of 10% per year and the men increase at the rate of 5% per year.
∴ Number of men subscribers in 2007 = m(1 + 0.05)7 ≈ m[1 + 7C1 (0.05) + 7C2 (0.05)2 + 7C3 (0.05)3]
≈ m(1 + 0.35 + 0.0525 + 0.0043)
≈ 1.4m
Number of women subscribers in 2007 = w(1 + 0.1)7 ≈ w [1 + 7C1(0.1) + 7C2 (0.1)2 + 7C3 (0.1)3]
≈ w
≈ w(1 + 0.7 + 0.21 + 0.035)
≈ 1.95w
Now, it is given that in 2003, men are 60% of the total European subscribers. So, women are 40% of the subscribers. Let the total European subscribers be P. Then,
m = 0.6P and
w = 0.4P
∴ The total number of subscribers in 2003 = m + w = 0.6P + 0.4P = P
And the total number of subscribers in 2007 = 1.4m + 1.95w
= 1.4(0.6P) + 1.95(0.4P)
= 0.84P + 0.78P = 1.62P
∴ Percentage growth of subscribers between '03 and '07 = × 100 = 62%
Hence, option (a).