

Q11
The highest amount of savings accrues to a member of which family?
Answer: A
A member of the Ahuja family has the highest income and lowest expenditure. He/she has the highest amount of savings.
Hence, option (a).
Answer it first: the answer and the solution appear right after.
Questions on this set: Q9 Q10 Q11 Q12
Answer the following question based on the information given below.
The data points in the figure below represent monthly income and expenditure data of individual members of the Ahuja family , the Bose family , the Coomar family , and the Dubey family . For these questions, savings is defined as
Savings = Income − Expenditure
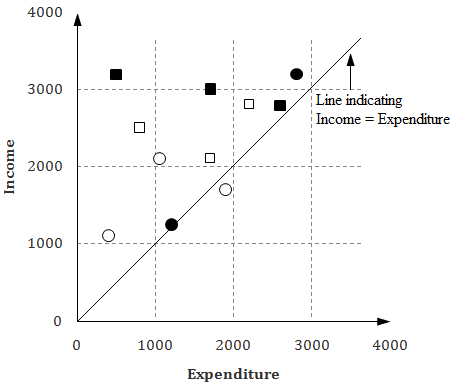
The highest amount of savings accrues to a member of which family?
Answer: A
A member of the Ahuja family has the highest income and lowest expenditure. He/she has the highest amount of savings.
Hence, option (a).