

CAT · 2003 · Question 33 of 50

CAT 2003 (Retake) LRDI Question 33 · DI - Tables & Graphs

Answer it first: the answer and the solution appear right after.

Questions on this set: Q32 Q33 Q34 Q35

Answer the following question based on the information given below.

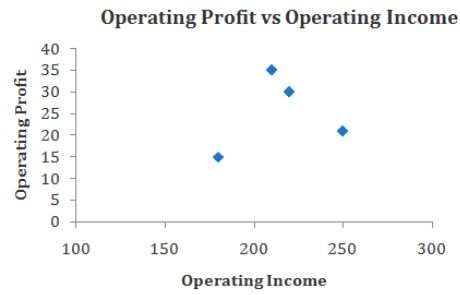
The profitability of a company is defined as the ratio of its operating profit to its operating income, typically expressed in percentage. The following two charts show the operating income as well as the profitability of six companies in the Financial Years (F.Y.s) 2001-02 and 2002-03.

The operating profits of four of these companies are plotted against their respective operating income figures for the F.Y. 2002-03, in the third chart given below.

Q33 DI - Tables & Graphs MULTIPLE CHOICE

Which company recorded the highest operating profit in F.Y. 2002-03?

→How much is Japan's export to India worth?CAT 2025 LRDI Slot 1 →What was the SI of E in 2016?CAT 2025 LRDI Slot 2 →What was the duration of calls (in minutes) from Bijay to Anu?CAT 2025 LRDI Slot 3 →In which city did the gender gap, in terms of 2025 prices, change the least, from 2005 to 2015, in terms of p…XAT 2025 QADI