

Q25
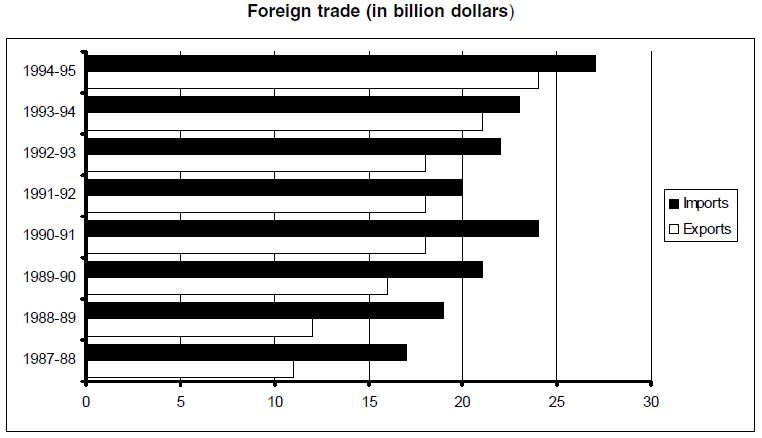
Which of the following statements can be inferred from the graph?
I. In all the years shown in the graph, the trade deficit is less than the export earning.
II. Export earnings increased in every year between 1989-90 and 1991-92.
III. In all the years shown in the graph, the earning by exports is less than the expenditure on imports in the preceding year.
Answer: A

The first statement is obviously true as the trade deficit in each year is less than the export earning. The export earning has remained constant for three years between 1990 and 1993. Hence, statement II is not true. Even statement III is not true as the exports in 1994-95 is more than the imports in 1993-94.