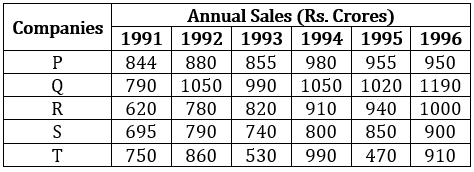
Since the reference year for the growth rate is not given, the growth is considered w.r.t. the previous year i.e. 1990 in this case.
Since no data is provided for 1990, the growth rate for 1991 cannot be found.
Hence, option (d).
Q4MULTIPLE CHOICE
If the five companies together have a 50% market share in that industry in 1994, what is the approximate market share of Q in 1994? Market share of a particular company in a given year is the sales of that company in that year as a percentage of the total sales in that industry for the same year.
Answer: B
Total sales of the 5 companies in 1994 = 980 +1050 + 910 + 800 + 990 = Rs. 4,730 crores
Since the five companies given have 50% of the market share,
Total sales of these five companies = 50% of total sales of all companies in the market i.e., market size.