Practice · DI - Tables & Graphs · 8 questions

PE 1 - Tables & Graphs

Answer each question to see the solution straight away. Use the keyboard to move faster.

Answer the next 4 questions based on the information given below.

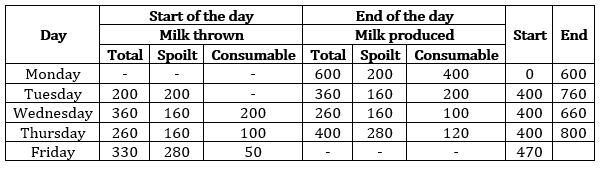
The table below gives the details of amount of milk produced in a dairy farm. All numbers are in liters.

​​​​​​​

Every day certain amount of milk is produced in the farm. Some of it gets spoilt due to contamination and is thrown away at the start of next day. Rest of the milk is considered consumable.
 
Spoilt milk from the previous day is thrown only at the start of the day, starting from Tuesday.
 
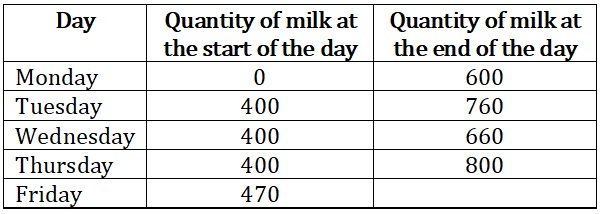
Amount of milk thrown away at the start of the day = Quantity of milk at the end of previous day – Quantity of milk at the start of the day.

50% of the consumable milk produced on any day gets spoilt after 2 days and is thrown away. 

Q1 MULTIPLE CHOICE

How much consumable milk (in liters) was produced in the farm till Thursday?

Video explanation
Q2 MULTIPLE CHOICE

How much consumable milk (in liters) was thrown at the start of Wednesday?

Video explanation
Q3 MULTIPLE CHOICE

Maximum quantity of spoilt milk (in liters) produced any day from Monday to Thursday is?

Video explanation
Q4 TYPE IN THE ANSWER

How much consumable milk (in liters) was there at the end of Thursday?

Video explanation

Answer the next 4 questions based on the information given below.

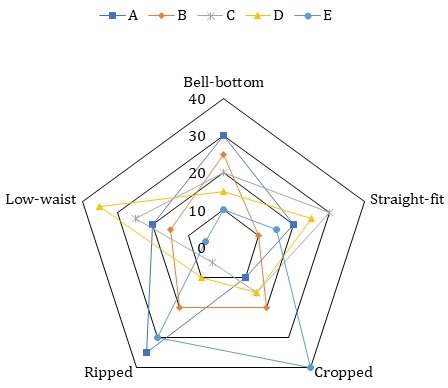
5 different manufacturers A, B , C, D and E operate in jeans manufacturing industry. They manufacture 5 different categories of jeans i.e., Bell-bottom, Straight-fit, Cropped, Ripped and Low-waist.

The chart below shows the market share of each manufacturer as a percentage of the total market share of the 5 manufacturers taken together across 5 different categories. For e.g. out of the total market share of 5 manufacturers for Straight-fit jeans 30% belongs to C.

​​​​​​​


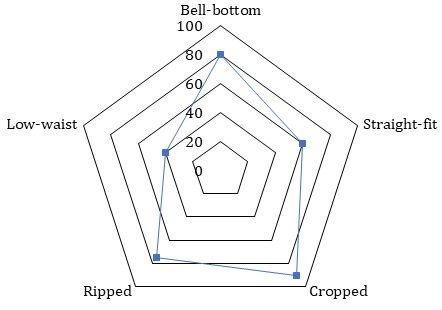
The chart below shows the total market share of these 5 manufacturers as a percentage of total industry size. For e.g., out of the total sales of Ripped jeans, 75% belongs to these 5 manufacturers.

Q5 MULTIPLE CHOICE

The total market size for Bell-bottom, Straight-fit, Cropped, Ripped and Low-waist in India are in the ratio 1 : 5 : 3 : 4 : 2. What percentage of revenue is generated by A by selling ‘Ripped’ jeans?

Video explanation
Q6 MULTIPLE CHOICE

The market size for ‘Bell-bottom’ type jeans is Rs. 30 Crores. What is the market size of ‘Straight-fit’ if the revenue generated by C by selling ‘Bell-bottom’ type jeans is the same as the revenue generated by B and C by selling ‘Straight-fit’ type cars?

Video explanation
Q7 MULTIPLE CHOICE

What is the ratio of market size of Cropped type jeans and Low-waist type jeans if revenue generated by D from 'Cropped' type jeans is the same as the revenue generated by E from the sale of 'Low-waist' type jeans?

Video explanation
Q8 MULTIPLE CHOICE

Find the ratio of the market size of Bell-bottom, Straight-fit and Ripped respectively given that the highest amount of revenue generated by any of these five manufacturers from the sale of each type of these six jeans are the same.

Video explanation