

Q1
What is the approximate percentage of schools, where the enrolment was below 120?
Answer: A
A written solution for this question isn't available yet.
Click an option to answer, or type your answer for TITA questions. The answer key and solution appear right after. Written solutions: 0 of 40.
The following table gives the enrolment in Higher Secondary Schools in 1978. Study the table carefully and answer these questions.
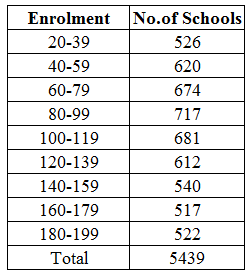
What is the approximate percentage of schools, where the enrolment was below 120?
Answer: A
A written solution for this question isn't available yet.
What is the approximate percentage of schools, where the enrolment was above 79 but below 180?
Answer: B
A written solution for this question isn't available yet.
Under which class, the maximum numberof schools fall?
Answer: B
A written solution for this question isn't available yet.
What is the approximate percentage of the least number of schools for the classes of enrolment ?
Answer: B
A written solution for this question isn't available yet.
What is the number of schools where the enrolment is above 99 but below 1607 ?
Answer: C
A written solution for this question isn't available yet.
What is the average enrolment per HS School?
Answer: C
A written solution for this question isn't available yet.
The following table gives Population and Activities of Indian Children (1993-94). Study the table carefully and answer these questions.
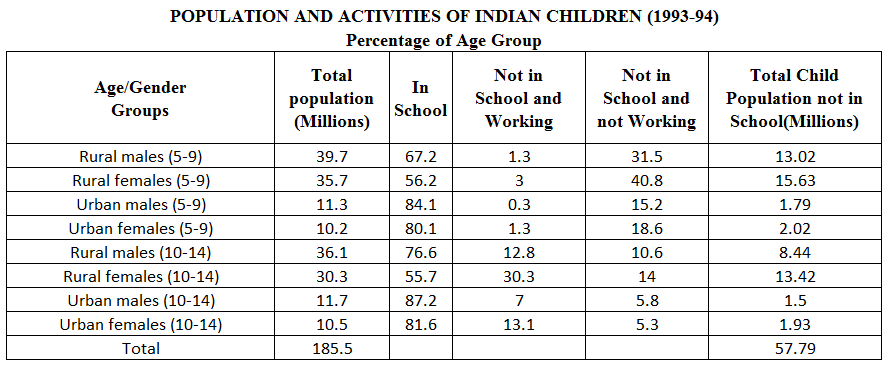
What is the average of Rural Males Population in millions ?
Answer: C
A written solution for this question isn't available yet.
In which category of populatoin, there is the lowest percentage of children in the school ?
Answer: D
A written solution for this question isn't available yet.
What is the approximate percentage of children of all categories not in school ?
Answer: D
A written solution for this question isn't available yet.
What per cent is the ratio between urban males and rural males not in school ?
Answer: C
A written solution for this question isn't available yet.
What is the approximate number of children in millions who are working ?
Answer: B
A written solution for this question isn't available yet.
What is the approximate percentageofall categories of children not in school and not working ?
Answer: D
A written solution for this question isn't available yet.
In which category of children, there is maximum number not in school and not working?
Answer: C
A written solution for this question isn't available yet.
In which category of children, there is maximum number not in school but working?
Answer: B
A written solution for this question isn't available yet.
What percentage of the total population of the children of all categories is in the school?
Answer: A
A written solution for this question isn't available yet.
What approximately is the percentage ratio between the total number of children not in school and in school?
Answer: C
A written solution for this question isn't available yet.
Study the following graph and answer these questions given below it.
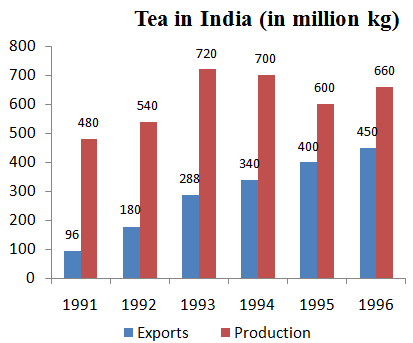
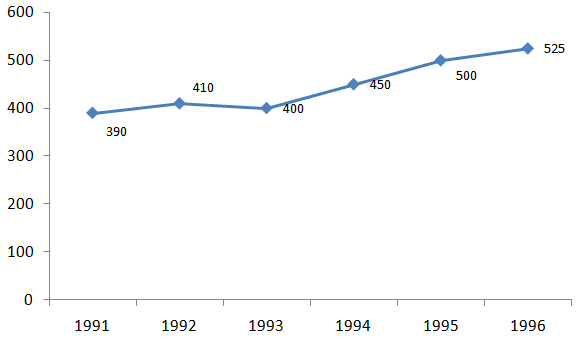
Which year shows the maximum percentage of export with respect to production?
Answer: C
A written solution for this question isn't available yet.
The population of India in 1993 was
Answer: B
A written solution for this question isn't available yet.
If the area under tea production was less by 10% in 1994 than in 1993, then the approximate rate of increase in productivity of tea in 1994 was
Answer: D
A written solution for this question isn't available yet.
The average proportion of tea exported to the tea produced overthe period is
Answer: B
A written solution for this question isn't available yet.
What is the first half decade's average per capita availability of tea ?
Answer: D
A written solution for this question isn't available yet.
In which year was the per capita availability of tea minimum ?
Answer: C
A written solution for this question isn't available yet.
In which year was there minimum percentage of export with respect to production?
Answer: A
A written solution for this question isn't available yet.
In which year we had maximum quantity of tea for domestic consumption?
Answer: C
A written solution for this question isn't available yet.
What approximately was the average quantity of tea available for domestic consumption during the period?
Answer: A
A written solution for this question isn't available yet.
What was approximately the average population during the period?
Answer: D
A written solution for this question isn't available yet.
Study the table given below and answer these questions.
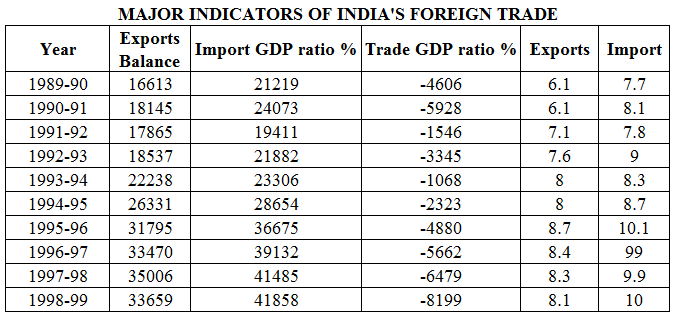
In which period, did we have the most adverse trade balancefor India ?
Answer: C
A written solution for this question isn't available yet.
What was the average % growth rate of exports during the entire period ?
Answer: D
A written solution for this question isn't available yet.
In which period was the trade balance the best ?
Answer: D
A written solution for this question isn't available yet.
In which period the growth rate of exports was the highest?
Answer: A
A written solution for this question isn't available yet.
During which period the Export/Import ratio was the highest ?
Answer: B
A written solution for this question isn't available yet.
What is the average growth rate of exports for the period 1992-93 to 1995-96?
Answer: D
A written solution for this question isn't available yet.
What is the average Export/ Import ratio for the period 1992-93 to 1998-99?
Answer: B
A written solution for this question isn't available yet.
Using Exports GDP ratio for the period 1989-90, find the GDP for the same period.
Answer: A
A written solution for this question isn't available yet.
Study the table given below carefully and answer these questions.
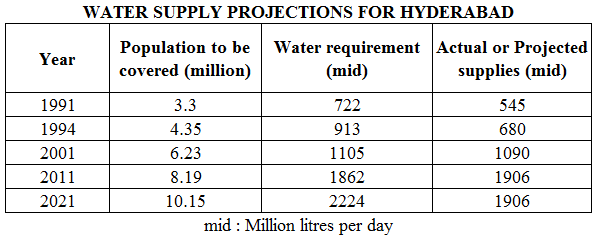
What is the average growth rate per year of population to be covered from 2001 to 2011?
Answer: A
A written solution for this question isn't available yet.
In which year was there maximum difference between water requirements and actual or projected supplies?
Answer: C
A written solution for this question isn't available yet.
In which year the actual or projected supplies exceeded/exceeds the water requirements?
Answer: A
A written solution for this question isn't available yet.
What approximately is the maximum per capita of actual or projected supplies as litres/day ?
Answer: C
A written solution for this question isn't available yet.
In which year, there was the least difference in per capita water requirements and the actual or projected supplies?
Answer: B
A written solution for this question isn't available yet.
In which year, there was the lowest per capita of water in actual or projected supplies?
Answer: C
A written solution for this question isn't available yet.